By Aleksandra Nenadic, Training Lead
Say you've got a Google spreadsheet with a column for addresses. It could be street addresses or postcodes. You want to map this data and embed the map into a website. Maybe you also want the map to update dynamically as more rows are added to the spreadsheet. What are your options?
This guide goes through the different ways to do this. However, to first map the data you’ll need to find the geocodes; i.e., latitude and longitude coordinates for these addresses. For locations that are more general, such as “UK”, geocoding APIs usually return the coordinates of the centroid—the area’s center point—or the capital.
Using Google My Maps
Google My Maps is a powerful tool designed to easily create custom maps from your data and share and publish maps online. You don’t need to worry about geocodes—they will be calculated for you out of addresses and postcodes.
To use this tool, you’ll need a Google account and you can either load data from a CSV, XSLX, KML or GPX file or link your Google spreadsheet (making sure it is either publicly available via "File" > "Publish to the web..." option in Google Spreadsheets or you have created a special sharing link for it).

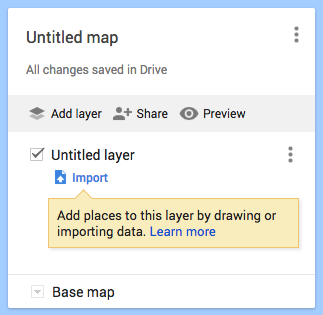
To generate a map, you need to load your Google spreadsheet data into a layer on a map. A default untitled layer is created for you when you create a map; you can have multiple layers from multiple sources.
During the import process from a Google spreadsheet, you should select the column from the spreadsheet that will be used to tell Google Maps where to put placemarks on the map, such as your addresses column. Google Maps will figure out the (latitude, longitude) coordinates from the addresses and postcodes automatically—quite handy and takes a lot of hassle out of the process. During the data import, you should also select a column that will be used as titles for placemarks.
Another nice feature is that all columns from your spreadsheet will be imported as well and displayed in a popover when you click on a placemark in the map. If you have some data in the spreadsheet that you don’t want to appear, make sure you remove it from your spreadsheet.
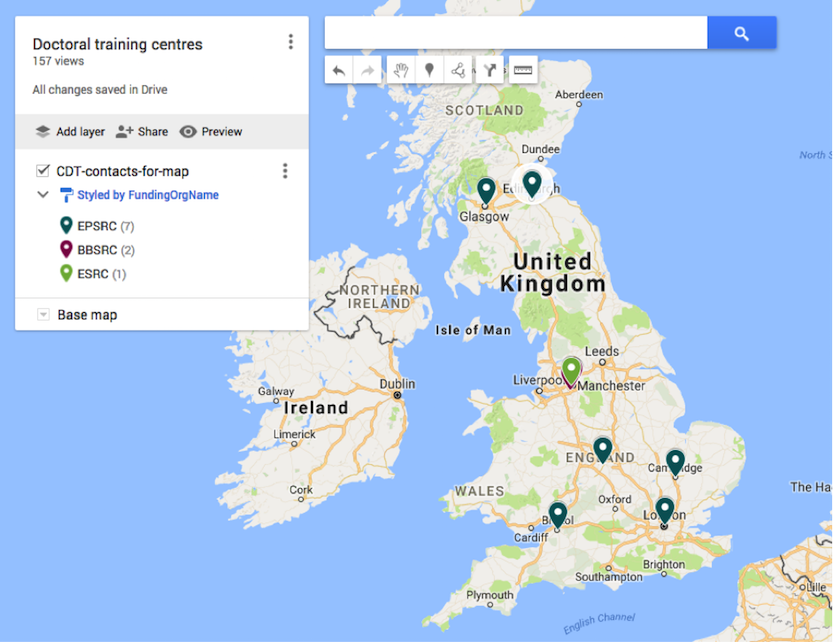
Finally, you can group your placemarks by any column name from your spreadsheet. Google Maps will colour placemarks from different groups using different colours (and you can choose the colours, too). It will also let you select a column to use as labels for placemarks on the map (by default no labels are shown).

Once you’re done with the data import, you can share the map with others or embed it in your website as an iframe with a simple HTML snippet that Google Maps provides for you.
However, bear in mind that if the data in your spreadsheet changes, these changes will not be reflected in your map. You will have to go to your map, delete the current layer and generate a new one from the same spreadsheet for the new data to become visible on your map.
Google My Maps is quite a powerful tool and you should consider using it if you are generating static maps or your data changes infrequently (in which case you will need to manually update the map).
Using Google Maps API
If you want your map to change with the underlying data—you need to build/update the map yourself by adding placemarks manually one by one using Google Maps JavaScript API (v3 at the time of this writing).
To generate a map from a Google spreadsheet, the following steps are needed:
Prepare the data in your spreadsheet—you need to know the geocodes of locations in the spreadsheet;
Get an API key for accessing Google Maps API and Google Sheets API from Google APIs/Developers Console.
Get your spreadsheet data in a format understandable by a script (Google spreadsheet is a web page not a data file); e.g., in JSON format;
Write some JavaScript that reads the JSON version of your spreadsheet and puts locations as markers on a map using Google Maps API.
1. Prepare the data
Often one of the most complex tasks in a mapping project is preparing the data. Before designing the map, adding layers, etc., the data needs to be in order.
Google Maps API uses data encoded in GeoJSON (i.e. geocodes) for map generation. GeoJSON is an open format for encoding geographic data, based on JSON (JavaScript Object Notation), and contains (latitude, longitude) coordinates of locations as part of geocodes.
Since your data is in a Google spreadsheet and not in GeoJSON, you need to figure out (latitude, longitude) coordinates of your locations, based on addresses/postcodes that you do have in your spreadsheet. To do that, you can:
Install a special Google Spreadsheets add-on called “Geocode Cells” that will generate 2 new columns containing latitudes and longitudes out of your column with addresses; or
Query Google Places API to return you longitude and latitude pairs for your addressed, inside the map generation script as part of Step 4 (not covered in this guide).
You also need to make sure your spreadsheet is publically available "File" > "Publish to the web..." option in Google Spreadsheets.
2. Get a Google API key
You need a Google API key to enable access from your script to the Google Maps API (in order to authenticate your request to create a map) and the Google Sheets API (to authenticate your request to get spreadsheet data as JSON).
You can get an API key from Google API Console (see full instructions). Basically, you need to:
Create a project in Google API Console;
Enable APIs that your project will access (in our case Google Maps API and Google Sheets API);
Generate an API key for the project (you can have multiple keys, and can set various restrictions—e.g. the key can be used only from certain websites/domains).
Use this API key in your JavaScript code.
3. Get the spreadsheet data as JSON
Google Sheets API (currently at v4) enables you to get your Google spreadsheet data as JSON. For example, you can access cells in column D of "Sheet2" starting with row 2 in JSON format at the following URL:
https://sheets.googleapis.com/v4/spreadsheets/ID_OF_YOUR_PUBLIC_SPREADSHEET/values/Sheet2!D2:D?key=YOUR_API_KEY
4. Use Google Maps API to create map
Finally, you can write some JavaScript to add your locations as markers on a map (see the working example on CodePen; source code is available on GitHub).
Google Maps API gives you all the flexibility you want in terms of choice of markers’ icons and colours, clustering your markers, etc. Some good tutorials and API reference can be found under Google Developers Documentation.
In the HTML body of your web page, you need to add a <div> placeholder for the map and a <script> tag with a call to the Google Maps API along with the name of your callback JavaScript function that will actually add your locations on the map. Something similar to:

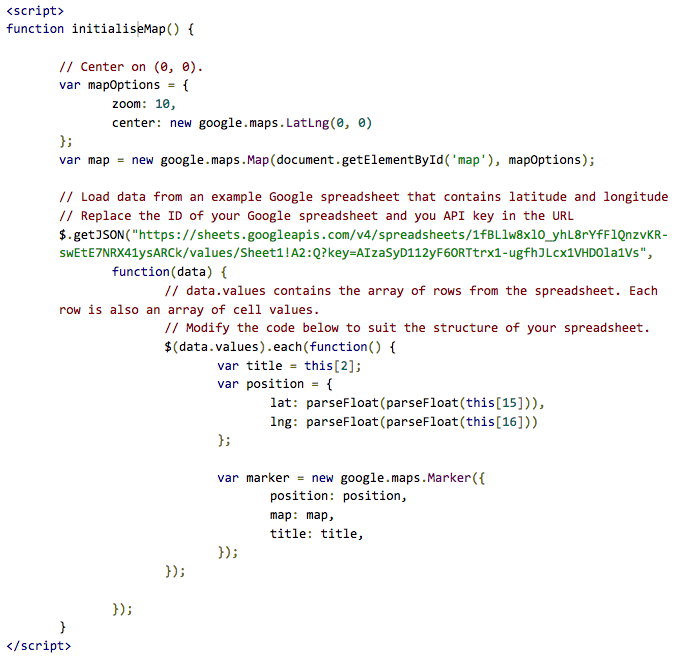
Finally, you need to define initialiseMap JavaScript function that will be called by the Google Maps API to load your data and generate the map. Something similar to the following (the code below is not tested; a working example can be found on CodePen and source code is also on GitHub).

Other options
Other options include using third party sites that claim to produce a dynamically updated map out of your spreadsheet data (e.g. MapList) or GitHub’s facility for Mapping geoJSON files uploaded to GitHub (thanks to Raniere Silva for pointing this out).


