Creating a domain-specific R course for Archaeologists
Posted on 27 June 2022
Creating a domain-specific R course for Archaeologists
By Alison Clarke with contributions from Emma Karoune, Michelle de Gruchy and Michal Michalski.
Last autumn, Emma Karoune and I ran a workshop for members of the Archaeology department at Durham University, introducing them to reproducible ways of working. In discussions following on from that workshop, it became apparent that there was a need in the department for a course on R. As the aim of my Software Sustainability Institute (SSI) Fellowship was to make software sustainability training more domain-specific, it seemed a good opportunity to create an R course for archaeologists.
Finding a starting point
Given the wealth of R training materials out there, it made sense to use an existing course as a starting point. I worked with Emma Karoune (archaeobotanist and fellow SSI Fellow) and Michelle de Gruchy (PDRA in Archaeology at Durham) to look over some existing material. As a Carpentries instructor I was drawn to the R courses in the Data Carpentry and Software Carpentry curriculums. We eventually decided to use the Data Carpentry course on Data Analysis and Visualization in R for Ecologists. We chose this course because it included a section on querying and SQL database from within R, which Michelle thought was something that was becoming more necessary in her field, and because the data used was understandable enough by archaeologists as it stood. At that point in the planning stage of the workshop, we couldn’t be certain that we would have time to adapt the course before we ran it.
Adapting the course
The starting point for adapting the course was simply to fork the repository in GitHub, making sure I updated the repository description to explain what the intention was. I started with a simple search/replace on text to change “Ecology” to “Archaeology”, which should have been the easiest part. However, I ran into some permissions issues when enabling GitHub actions on the repository (which build the site and publish it to GitHub pages), so I had to switch to using a different action to publish to GitHub Pages. That worked and so I had a course website!
The next step was to determine what data to use. The Ecology course uses a data set of observations of small mammals in a desert ecosystem in Arizona, USA. We did search for real archaeological data sets that we might be able to use, but adapting the course to the data would have been a mammoth task. Emma contacted Ben Marwick, a big advocate of reproducible archaeology, and author of a paper How to Use Replication Assignments for Teaching Integrity in Empirical Archaeology, to ask for suggestions. Ben suggested simply modifying the existing data to make it look like something archaeological (whilst ensuring we made it clear that this was mock data), so that’s the route we went down.
Michelle and I spent a while looking at the data and determining how we could modify it to look reasonably like a dataset about ceramics. For text data, we had to work out how many values we would need for each column in order to find something for which there might be a similar number of values. There was also a binary category of male/female (with some missing values), which we needed to replace with something that similarly could only have 2 values: Michelle suggested we use diagnostic (either ‘base’ or ‘rim’) instead.
Ben Marwick had suggested we just use dummy data such as type1, type2, etc, but Michelle was keen to make it look more real, so created lists of a sufficient number of periods, decoration types and ceramic types. I then went through the existing data to change the column names and to replace the values in the CSV (using R, of course!). Once the data set had been created, I uploaded it to Zenodo so it could be downloaded via R in the same way as the existing data set.
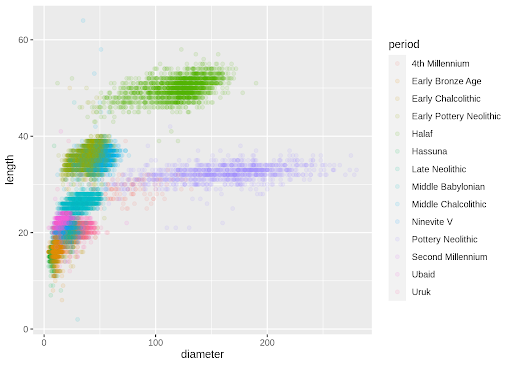
The next step was to update the course materials to point to the new data set (making it clear it’s a mock data set!) and to use the new columns. Some of this could be done by search and replace but as might be expected, there were a lot of cases where that wasn’t sufficient, so I had to go through each lesson to manually check and update it. The fact that the Data Carpentries lessons are written in RMarkdown was really helpful here, as it meant that the code snippets could be compiled to check that they worked as expected. And it was quite exciting to see our mock data come to life in the visualization section (even if some of the data didn’t quite make sense)!

Trialing the course
We ran the course on 3-hour sessions a week apart. I was a little nervous about teaching R when I haven’t used it to a great degree myself, so Michelle introduced me to Michal Michalski, a PhD student at Durham, who has a wealth of industry experience using R, and is also a Carpentries instructor. So I taught the first part, and Michal taught the second, with Michelle and Emma acting as helpers.
The course was a succession of ‘firsts’: the first time we’d used this material with the updated dataset; the first time I’d taught in-person (as all my past teaching had been online due to COVID), and the first time several of us had organised a hybrid event! Inevitably there were some hiccups, such as not having enough power sockets in the room for part 1, not having the right tech in the room for part 2, and having to evacuate the room due to low air quality! We also didn’t manage to cover as much material as we’d hoped, as we wanted to go slowly enough for everyone to keep up and feel free to ask questions.
We gathered feedback Carpentries-style on one good thing, and one thing to be improved. Whilst there were some things we could improve on, we also had some really positive comments, including on how it was good to see ‘real-life’ data being used with the sort of analysis they need! Emma’s tweet about the course got quite a lot of traction on Twitter, so it seems that an R course using Archaeological data is a popular idea.
What next
We’re going to hold a follow-up session in a month, to let people come and ask questions or work through parts of the course we didn’t get to, so hopefully that will allow us to get further feedback on the course content. But what’s really heartening is that after the workshop an Rchaeology community at Durham has already started up, where users will be able to share code, ask questions, etc!
Since running the workshop I’ve submitted the lesson to the Carpentries Incubator to make it easier for others to find, to use and improve. It’s been accepted, so the new lesson Data Analysis and Visualization in R for Archaeologists can now be found at https://carpentries-incubator.github.io/R-archaeology-lesson. It would be great if it can contribute to turning more archaeologists into Rchaeologists!

