Reading Human Biomechanics Data into R
Reading Human Biomechanics Data into R
 By
By This blog post is part of the series of resources on learning to code, hosted as part of the Research Software Camp: Beyond the Spreadsheet.
Efficient management and analysis of large datasets is an ongoing issue within human biomechanics research. Analysing how people move using 3D motion capture, ground reaction forces and electromyography produces large amounts of complex data. This is often multiplied many times over depending on the number of movement trials and lab visits that are taking place in the work. Alongside this, the statistical and clinically meaningful outputs of participant data gathered in one lab is often insufficient. Combining human biomechanical lab outputs into an integrated database, could provide a large resource for data driven analysis and identify important trends within musculoskeletal conditions and treatment effectiveness.
Most research scientists deal with the data management conundrum to some degree. While many universities will support data management, analysis and software programme training, it’s often difficult to apply these principles into your own research data in a meaningful way.
Learning to code
The Research Software Camp Learning to Code programme organised by the Software Sustainability Institute allows you to benefit from a one-to-one mentorship for 2 months leading up to the Camp. The aim for this is to set some achievable goals within that time that can later be showcased at the Camp while potentially creating new research networks. I was paired with Dr Heather Turner, an EPSRC Research Software Engineer Fellow based at the University of Warwick who has expertise, knowledge and enthusiasm in statistical computing with R – an open source data software platform. Our goal was to get me to a stage where I was comfortable to play around with scripts, work on reading in a set of example biomechanics data and plot them into wavelengths. We set a structure for regular meetings and tutorial-based resources to work through that would be an introduction into working on sets of biomechanics data within R.
With minimal R experience, working through these resources with the benefit of regular meetings with Heather, was a productive escape from other research work. Similar to learning a new language, it will require time and effort before it’s part of my regular research practice. However, it turns out that graph visualisations in R are really satisfying, and the ggplot2 package has a big range of aesthetically pleasing plotting options for your data.
Working through these R tutorials (linked below) I found the R Studio Cloud Primers most helpful and a great introduction into using ggplot2 functions. This is a freely available resource, with all the necessary packages preloaded into the tutorials with example data and exercises to work through.
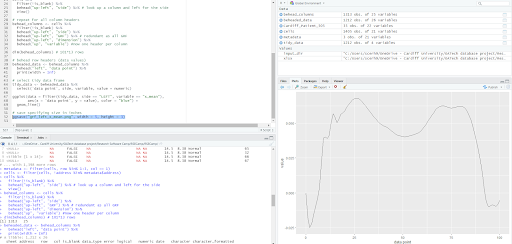
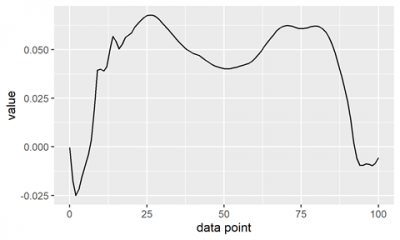
Since biomechanics datasets contain a lot of different information, we’ve started by solely looking at a ground reaction force data trial. We used the unipivotr package to help read and tidy the data in R as it facilitates handling spreadsheets with multi-headed data tables. Also used were dplyr, tidyxl and of course, ggplot2. One of the main issues with reading in and plotting this type of data will be the different ways in which it’s organized and this will likely take a lot of playing around with packages, functions and scripts. We’ve started with plotting one of the ground reaction force planes in a walking trial for a participant that’s been normalised to 101 data points (demonstrated below) and for me, it’s an exciting start!
Conclusion
The important thing about this mentorship was the consistency of our meetings and a set plan with weekly and achievable deadlines. The simple yet effective concept of being held accountable for tasks you set, is one that works. I also massively benefited from Heather’s expertise and patience! If you have the opportunity to sign up for something similar, with the SSI or elsewhere, I have found this an effective way to get you going with some software programming skills and applying them into your data and would absolutely recommend it.
Useful Links:
R tutorial resources
https://rladiessydney.org/courses/ryouwithme/01-basicbasics-0/
https://rstudio.cloud/learn/primers
unipivotr package resources