Software Sustainability training for Bioscience Postgraduate students
By Emma Rand, SSI Fellow.
I organise the Analytics training programme for PhD students on the White Rose BBSRC Doctoral Training Partnership in Mechanistic Biology supported by the Biotechnology and Biological Sciences Research Council (BBSRC) which, together with additional investment from the partner universities (York, Sheffield and Leeds), is currently supporting over 180 PhD studentships. The aim of the programme is to equip Early Career Researchers with the skills to make their work reproducible and sustainable. This work ties in with my Software Sustainability Fellowship project 'Developing the capacity of PhD students to infect their labs with reproducibility'.
The programme starts in the first year with Analytics 1: An introduction to Reproducible Research in R (Rand 2021) and continues in the second year with Analytics 2: Analysis of high-throughput biological data in R taught by Mark Dunning of The Sheffield Bioinformatics Core Facility.
This blog post covers the rationale behind the design of Analytics 1 and the experience level and current tool preferences of participants.
About the course
Analytics 1: An introduction to Reproducible Research in R has been running online for two years, with 56 participants in 2020 and 57 in 2021.
There are challenges in training first year postgraduate bioscientists on this programme. They can have first degrees in any science, computing or mathematics from a variety of universities worldwide and therefore have a wide range of previous coding experiences. They may be completely new to programming or have used statistical or general purpose languages for several years. However, they have a common interest in data analysis and visualisation so these are useful entry points for sustainable software practice.
There are many statistical and visualisation methods applied in the biosciences, and PhD projects are at an early stage so a person may not yet know which methods will be applicable. It is this diversity in both experience and requirements that has led me to shape the programme around workflow tools with widespread application for any biologist rather than teaching a selection of statistical methods which will have variable utility. These tools are:
- Project-oriented workflow and organisation.
- Foundational computational concepts.
- Data organisation, import and reformatting.
- Reproducible reporting.
These topics have been chosen because they are foundational, widely applicable and largely transferable between coding environments.
We use R (R Core Team 2021) because it is a free and open source language especially well-suited to data analysis and visualisation, which is our route into sustainable software practice for bioscientists. In addition, R has a relatively inclusive and newbie-friendly community and a reputation for “cater[ing] to users who do not see themselves as programmers, but then allow[ing] them to slide gradually into programming” (Peng 2018). R is thus an effective tool to introduce people to sustainable software practices, but the topics covered have more general applicability in the organisation and documentation of computational projects.
The programme comprises six modules lasting from 40 minutes to 2.5 hours. Participants are advised to attend the sessions that extend their skills. All the materials are licensed under a Creative Commons Attribution-NonCommercial-ShareAlike 4.0 International License and available on GitHub.
Modules
-
Introduction and Principles of reproducibility (40 mins)
Presents a rationale working reproducibly, scripting analysis and an overview of project organisation.
-
Introduction to R and working with data (2 - 2.5 hours)
An introduction for participants who are completely new to R which covers finding their way round RStudio, importing some data, summarising and plotting it. It provides a first contact with ideas explored in more detail in later modules such as RStudio Projects, data import, tidy data and data reformatting.
-
RStudio Projects (45 mins)
About Project-oriented workflow, working directories and paths, project organisation and naming things! Over many years in teaching computational biology I have seen people struggle not because of the analysis itself but because the ideas of working directory and paths are unfamiliar. This can cause a lot of stress and gives people the impression the computational analysis is too hard for them when they just have a small knowledge gap. Plugging this gap is very empowering!
-
Tidying data and the tidyverse including the pipe (1.5 - 2 hours)
What tidy data are and how they make your life easier along with an introduction to the tidyverse (Wickham et al. 2019) and walk-through of some commonly applied tidying operations using a case study from The Genever lab on stem cell proteomic data. I love this example - the data format typifies that seen in high throughput data with column headers over multiple rows, genes/proteins/transcripts in rows and treatment groups and replicates in columns.
-
Advanced data import (2 - 2.5 hours)
The aim of this session is to strengthen the ability to import data files regardless of the formatting and to introduce some of the other ways to import data, such as through web scraping and via APIs.
-
R Markdown for Reproducible Reports (2 - 2.5 hours)
To induct people into the wonderful world of R Markdown (Xie, Allaire, and Grolemund 2018) for creating reproducible reports in a variety of output formats.
Learning outcomes
After this training the successful learner will be able to:
- Find their way around the RStudio windows.
- Create and plot data using the base package and ggplot.
- Explain the rationale for scripting analysis.
- Use the help pages.
- Know how to make additional packages available in an R session.
- Reproducibly import data in a variety of formats.
- Understand what is meant by the working directory, absolute and relative paths and be able to apply these concepts to data import.
- Summarise data in a single group or in multiple groups.
- Recognise tidy data format and carry out some typical data tidying tasks.
- Develop highly organised analyses including well-commented scripts that can be understood by future you and others.
- Use R Markdown to produce reproducible analyses, figures and reports.
About the participants
Since I expect the participants to vary in their previous experience, I ask them complete this short form to help me understand their diversity and direct them to modules appropriate to them. The response rates are good and I hope to be able to collect this data for several years to understand the changing landscape of sustainable software practice amongst new PhD students.
There were 54 responding in 2020 (96.4%) and 55 in 2021 (96.5%).
Current experience
About a third of the group has no previous experience in R with another 20-25% having a little. Experience of other languages is less common (See figure 1) and most are not at all comfortable or a bit uncomfortable with the idea of working directories and and paths (See figure 2).
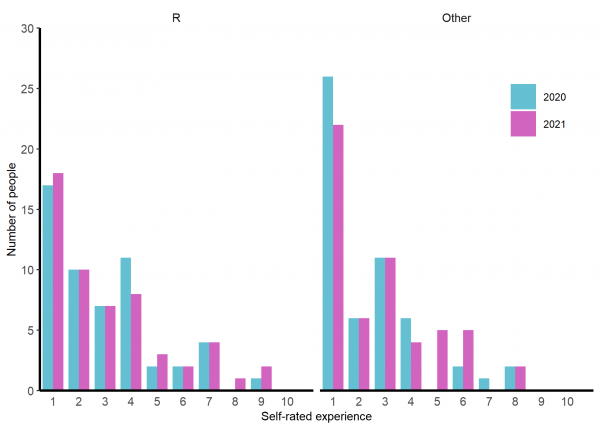
Figure 1: Participants self-rated experience of R (left) and their best other language (right) before the training. Rating 1 = ‘None, never used,’ 10 = ‘Expert - extensive use for several years’
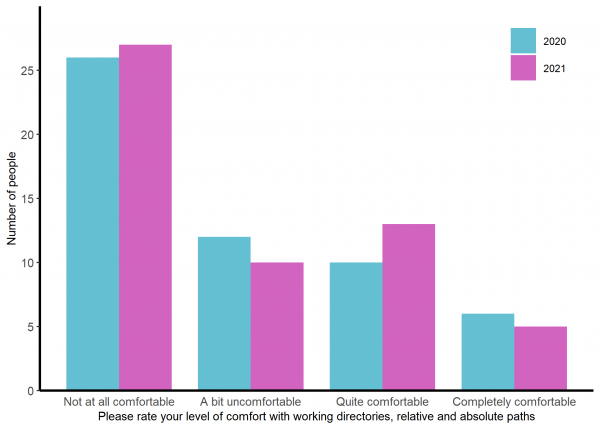 Figure 2: The comfort expressed by participants about working directories and paths
Current tools
The programmes people are most likely for use for data analysis and visualisation before they start the course are R, Excel (or its equivalents) and GraphPad Prism (See figure 3). In coming years, it will be interesting to see if the increased use of R, Python and Excel and decreased use of Prism and SPSS between 2020 and 2021 reflect a trend or simply random cohort variation.
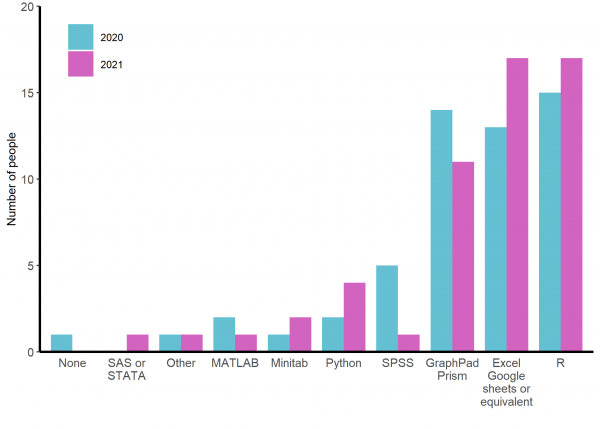 Figure 3: Responses of participants to ‘In what package/programme are you MOST likely to carry out data analysis and visualisation currently?’
Word, Googledocs or their equivalents are by far the most commonly used programmes for writing up analysis results to submit to a journal or similar (See figure 4). In 2021, there were 17 people who would use R for data analysis but only two of these would use R Markdown for reporting. I hope I managed to persuade these, at least, that R Markdown would benefit their workflow.
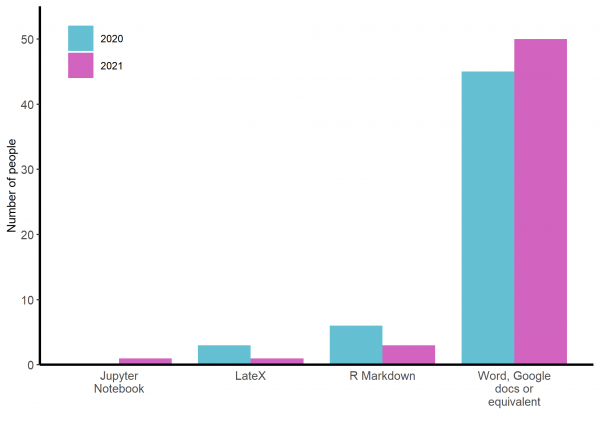 Figure 4: Responses of participants to ‘In what package/programme are you MOST likely to write up analysis results to submit to a journal or similar?’
In summary, the programme focuses on workflow tools which will be useful to those with no experience of R or other languages. Whilst some participants enter the programme with a little R experience, many have none and use primarily Excel or GraphPad Prism for analysis. Even amongst the R users, the dominant writing packages are Word and its equivalents. An aim of the programme is to encourage people to use more reproducible reporting workflows such as R Markdown.
White Rose BBSRC Doctoral Training Partnership (DTP) in Mechanistic Biology Analytics 1: Introduction to reproducible analyses in R by Emma Rand is licensed under a Creative Commons Attribution-NonCommercial-ShareAlike 4.0 International License.
![]()
References
Peng, Roger D. 2018. “Teaching R to New Users - from Tapply to the Tidyverse.” Brisbane, Australia: UseR! The conference for users of R.
R Core Team. 2021. R: A Language and Environment for Statistical Computing. Vienna, Austria: R Foundation for Statistical Computing. https://www.R-project.org/.
Rand, Emma. 2021. “White Rose BBSRC DTP Training: An Introduction to Reproducible Analyses in R. 2021.” Zenodo. https://doi.org/10.5281/zenodo.4701167.
Wickham, Hadley, Mara Averick, Jennifer Bryan, Winston Chang, Lucy McGowan, Romain François, Garrett Grolemund, et al. 2019. “Welcome to the Tidyverse.” JOSS 4 (43): 1686.
Xie, Yihui, J J Allaire, and Garrett Grolemund. 2018. R Markdown: The Definitive Guide. CRC Press.