Everything is R-some: UseR 2016
Posted on 16 August 2016
Everything is R-some: UseR 2016
 Dr Becca Wilson, Software Sustainability Institute Fellow, Research Fellow, Data 2 Knowledge Research Group, University of Bristol
I attended the 2016 UseR conference at Stanford University 27th–30th June 2016. This year’s UseR Conference was of particular importance as it coincided with the 40th anniversary of the S statistical programming language (the precursor to R) and the 75th birthday of Professor John Chambers—a co-creator of S. The conference was highly attended, with around 900 registered delegates split 50:50 across academia and industry. Those unable to attend could follow #useR2016 on twitter and watch the stream from keynote talks live, all talks were recorded and are available online.
The opening keynote Forty years of S by Rick Becker, co-creator of S at Bell Labs in the 1970’s, was a nostalgic look back at the origins of the ‘S’ statistical language. Rick highlighted how far analytic processing has come—when in the 1970s batch computing was done via punch cards, processing for a regression analysis took two hours and then you had to wade through pages of print out to identify the solution. Ultimately R was released as an open source alternative to the licensed S, with much of its functionality retained from S including the use of <- as the assignment syntax due to keyboards at the time:
The assingment operator on a keyboard from the 70ties @useR_Stanford #useR2016 pic.twitter.com/iTT7f0ize7
— eoda (@eodaGmbH) June 28, 2016The remainder of the programme was packed full of training tutorials, interactive talks, demonstrations, method development and cross-domain applications. Throughout the conference, I noticed a few trends:
1) Industry Involvement
Before attending UseR, I hadn’t appreciated the extent to which R is integrated within industry at every stage of the data lifecycle. Many of the sponsor exhibition stands demonstrated how their databases or infrastructures (Oracle, Terradata, H2O.ai) and cloud services (Google Cloud, Microsoft Azure) are integrated with R, and that they are actively developing R packages released to bioconductor or CRAN. There are even R plugins for both Google Sheets (e.g. Blockspring and Dukedeploy) and Microsoft Excel (e.g. RExcel) for enhanced statistical analysis.
A lady on the Terradata stand explained to me that graduates entering the workforce have been using R for data analysis during their degrees. This is one of the reasons R is filtering out beyond academia and research, becoming a common analytic tool in business and industry.
Further industry involvement is through the formation of the R Consortium in 2015 to support and maintain the distribution of R and the R Community.
2) Interactive Graphics
There was a large number of talks and tutorials around user interfaces and developing interactive graphics either as a means for data exploration amongst researchers or for embedding within websites.
Interactive graphics tutorial @useR_Stanford is packed - people are sitting on the floor! #useR2016 #TooManyRGeeks pic.twitter.com/gyFDmKzIgW
— Becca Wilson (@DrBeccaWilson) June 27, 2016I think this is reflective that R can be used as an analytic tool within any discipline,for qualitative and quantitative analysis as well as data visualisation.
3) Diversity
There were a couple of talks about increasing gender diversity in the R community. One from the London R-ladies group who run R meetups aiming to encourage, support and train women who either use or want to use R—I suggested they work together with the Software Sustainability Institute and Software Carpentry. The R Foundation Women in R Taskforce has also been working to increase the number of women giving talks, being panel members and running R tutorials throughout the UseR conference. The taskforce also introduced a code of conduct at the UseR conference to discourage and prevent harassment and inappropriate behaviour, language and imagery used in talks. One of the most novel policies that the taskforce has introduced is that UseR 2017 will have childcare. The hard work is paying off, at UseR 2016 30% of the 900 delegates were female,with 19% of talks, 25% lightning talks and 28% posters being presented by women.
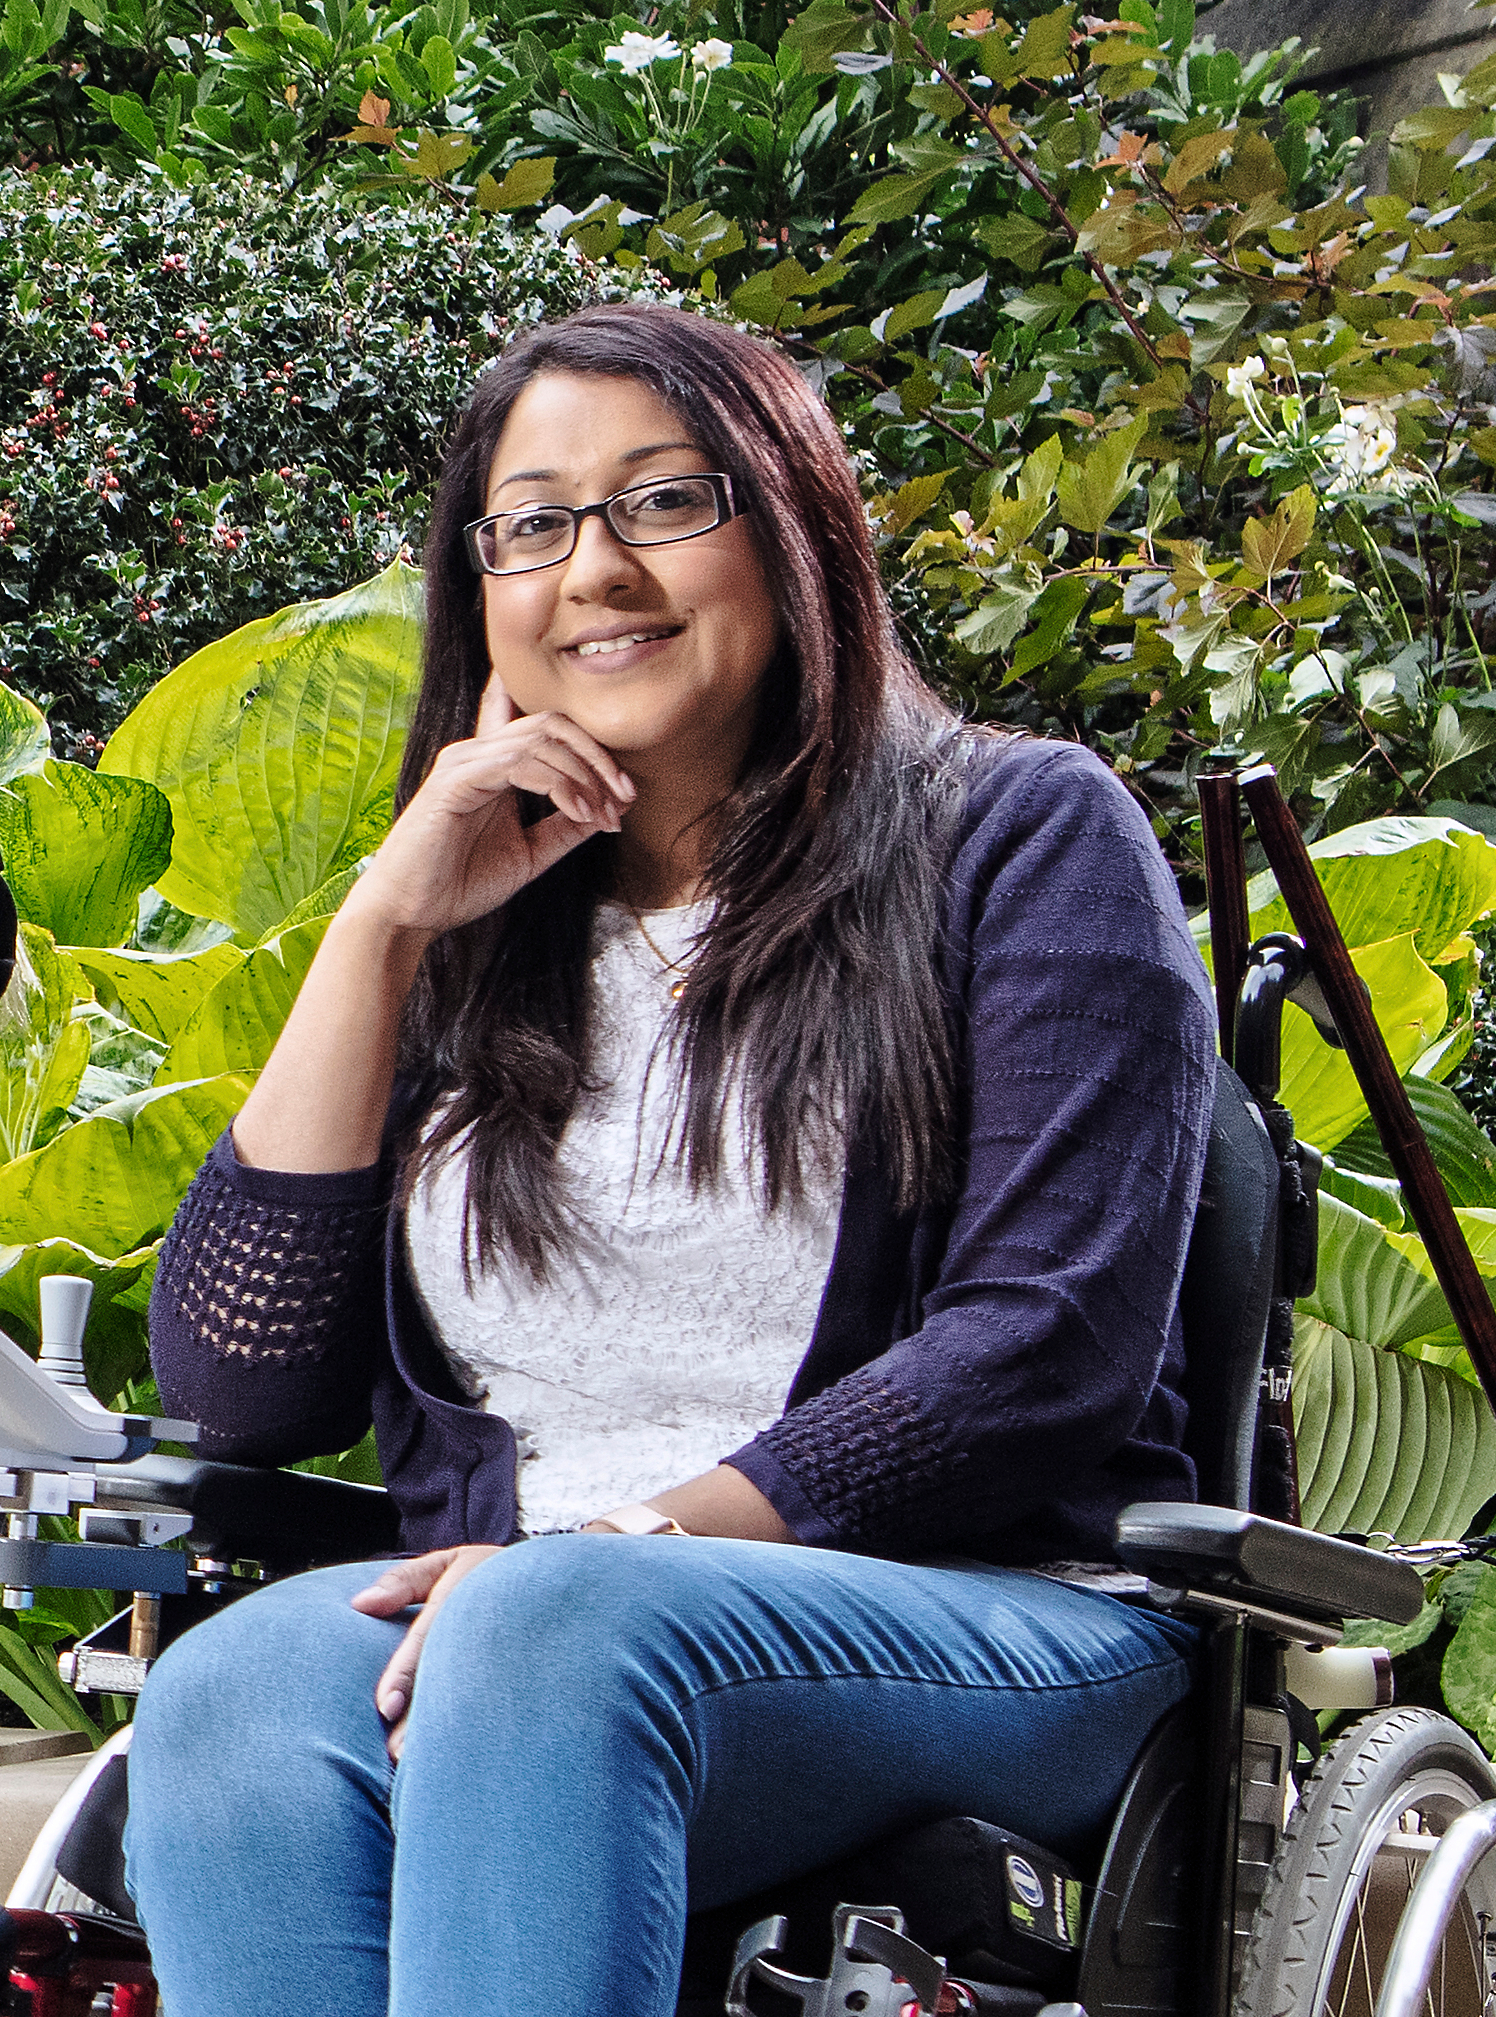
Diversity at UseR went beyond gender diversity, I myself as a wheelchair user found it the most stress-free conference/meeting I have ever attended. UseR2016 offered the standard grants for early career researchers to attend the conference, but also ran an additional diversity scholarship. I was awarded one of the diversity scholarships, which I used to cover the cost of my carer/support worker to travel with me to attend this conference. This is the first time I have heard of a grant to support diversity at any conference. Without grants like this being made available to disabled researchers, I would have to cover these additional costs myself - this makes attending any conferences/meetings outside of the UK prohibitively expensive and therefore a career barrier.
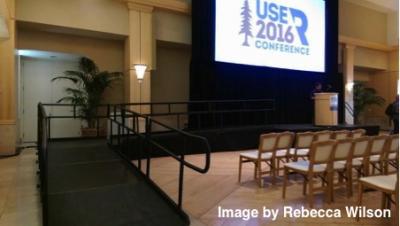
The conference organisers put me in touch with the Stanford University Diversity and Access Office who gave me a building plan of every building being used in the conference and provided information about medical equipment hire and accessible taxis. The whole campus was accessible. I could attend any talk as every room used in the conference programme was accessible by wheelchair. Furthermore, they had a ramp built in so I could get up onto the stage to deliver my talk. I can only commend the organising committee for making the conference completely wheelchair accessible.

DataSHIELD at #useR2016 @DrBeccaWilson @Data2Knowledge #d2kDatashield #R-some pic.twitter.com/aTG7N2yhCh
— Dr Olly Butters (@DrOllyButters) June 30, 2016I look forward to participating in UseR2017 on 4th–7th July 2017, in Brussels.

