It's impossible to conduct research without software, say 7 out of 10 UK researchers
It's impossible to conduct research without software, say 7 out of 10 UK researchers
Posted on 4 December 2014
It's impossible to conduct research without software, say 7 out of 10 UK researchers
 By Simon Hettrick, Deputy Director.
No one knows how much software is used in research. Look around any lab and you’ll see software – both standard and bespoke – being used by all disciplines and seniorities of researchers. Software is clearly fundamental to research, but we can’t prove this without evidence. And this lack of evidence is the reason why we ran a survey of researchers at 15 Russell Group universities to find out about their software use and background.
Headline figures
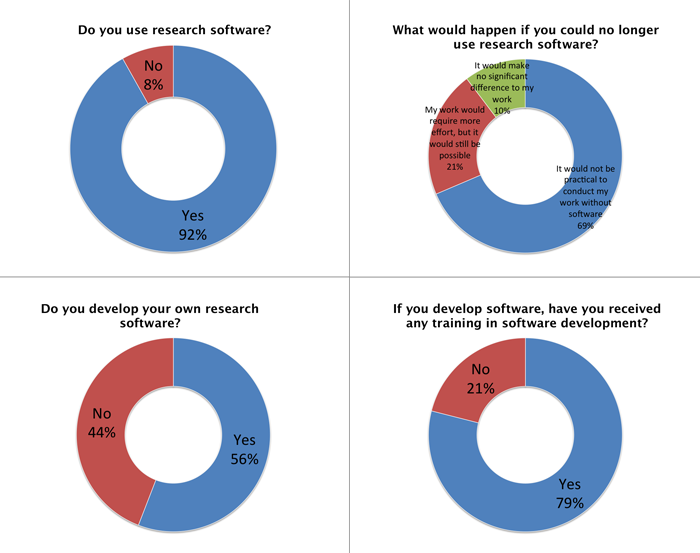
- 92% of academics use research software
- 69% say that their research would not be practical without it
- 56% develop their own software (worryingly, 21% of those have no training in software development)
- 70% of male researchers develop their own software, and only 30% of female researchers do so
Data and citation
The original analysis for this project was conducted using Excel. To improve openness and reproducibility, I re-analysed the data using Python as described in my post on the subject. Since the new analysis agrees with old analysis but it considerably easier to work with, I suggest that the new analysis is used for all future citation.
In which case, please cite "S.J. Hettrick et al, UK Research Software Survey 2014", DOI:10.5281/zenodo.1183562. The data is licensed under a Creative Commons by Attribution licence and the analysis is licensed under a BSD 3-clause licence (in both cases attribution to The University of Edinburgh on behalf of the Software Sustainability Institute).
(Of course, the old and superseded analysis is still available too: DOI:10.5281/zenodo.14809 and released under the same licence as the new analysis).
Software is far more important to research than anyone knows
If we do not know how much we rely on software, we cannot ensure that researchers have the tools and skills they need to stay at the forefront of research. We collected evidence – for the first time at this scale - of research software use, development, and training. In addition, we collected demographic data so that we can investigate questions like “Are men more likely to develop software than women?” (the answer, as it turns out, is yes - but women are equally likely as men to use research software).
The team
Thanks to Mario Antonioletti, Neil Chue Hong, Steve Crouch, Devasena Inupakutika, and Tim Parkinson for their help constructing the survey, developing the underlying code and analysing the results. Thanks also to our Fellows for being guinea pigs during the drafting of the survey.
The scale of the survey
The survey results described here are based on the responses of 417 researchers selected at random from 15 Russell Group universities. We gained good representation from across the disciplines, seniorities and genders. This is a statistically significant number of responses that can be used to represent, at the very least, the views of people in research-intensive universities in the UK.
Limitations
The main problem of running a blind survey is that it needs to be short to maximise responses. This means we’ve had the opportunity to uncover facts about software use, but we haven’t had the space to investigate causes. We will be running follow up research to do so.

How many researchers use software?
It’s not overstating the case to say that software is vital to research. If we were to magically remove software from research, 7 out of 10 researchers would be out of a job.
92% of respondents said they used research software. More importantly, 70% of respondents said that “It would not be practical to conduct my work without software”.
Variation in use with seniority of respondent
The use of research software varies little with seniority.
It’s difficult to measure seniority, so we simply asked how many years the respondents had worked in research. There isn’t a great deal of variation: the percentage of use varies by 12% with those having worked in research for 6-10 years reporting the most use (98%) and those having worked for more than 20 years in research reporting the lowest use (86%).
The first two categories – those have worked less than a year, and those that have worked for 1-5 years – report 91-92% use. Use peaks in the next ten years and then drops in the 15-20 year and more than 20 year groups.
There are different ways to explain this variation. Unfortunately, they cannot be confirmed by our data. It seems likely that low- and mid-seniority researchers are the workhorses of research and do the most generation of results – and hence are most likely to use software. Once a researcher gets more senior, there is the tendency to perform more management duties which makes them less likely to use research software.
What software are people using?
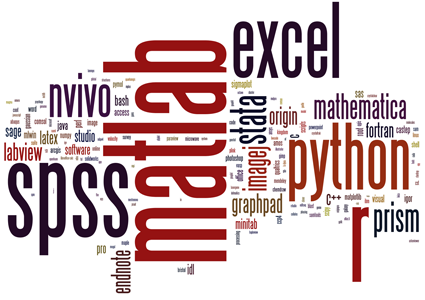
A lot of different software is being used: we recorded 566 different packages - some of them have only one user within our surveyed community, some with many. The most popular packages are Matlab (20% of respondents use it), R (16%), SPSS (15%), then Excel (12%). To show the use diagrammatically, we created the Wordle shown at the top of the page.
A lot of researchers are developing their own software – even though they lack training
It’s not just proprietary software, many researchers are developing their own code: 56% of them. This is great news, because the real power of software lies in developing it to allow you to do more in less time and make new research possible.
Many people in the research community are developing their own software, is the development in safe hands?
55% of respondents have received some training in software development (15% self taught and 40% had received some form of taught course). Worryingly, 21% of respondents who develop their own software had no training in software development. That’s one in five researchers developing software blind.
Software that is developed without adequate training is unlikely to be reliable. Researchers are, by their very nature, intelligent people who learn new skills quickly, but there are many subtle pitfalls in developing good code (that is, code that won’t later lead to paper retractions). And that’s only the case for reliability! We want defensible results, which requires a whole swathe of skills related to producing reproducible code, and we want to protect the research investment, which requires yet more skills for writing reusable software.
Changes across disciplines
The primary funder is a useful way to split respondents into different disciplines. Around half of our respondents were primarily funded by the EPSRC, university central funds and “other” (which drew together a wide range of funders from private funds to overseas research funders). The other half of respondents were split fairly evenly over the remaining research councils, EU funding and the big trusts and charities.
The use of research software is fairly even across all respondents regardless of their primary funder: something in the region of 87-100% is typical. The notable exception was respondents primarily funded by the AHRC, of whom only 60% use research software.
The gaps begin to appear when we look at respondents who develop their own software. Respondents can be split into three groupings. Leading the way are STFC-, NERC- and EPSRC-funded researchers with 93%, 90% and 79% of them, respectively, developing their own software. The next grouping occurs around the 50% mark – a group that contains respondents funded by most of the other funders. The third group is made up of respondents funded by the National Institute for Health Research (31%), industry (17%) and the AHRC (10%).
Unsurprisingly perhaps, the percentage of researchers who have received some form of software development training tracks the percentage of who develop software. There is a variation between these categories of around +/- 10%
Software development costs are not being included in bids
Many researchers believe that including costs for developing software in a proposal will weaken it. We’ve had steer from the Research Councils that this is not the case - something we’re trying to persuade the research community to believe. But we may have our work cut out.
When we asked the people who are responsible for writing proposals whether they had included costs for software development, 22% said that they had, 57% said they had not, and 20% said that they had not even though they knew software development would make up part of the bid! (Note that rounding errors make these figures sum to 99%.)
Differences in software use with respect to gender
Women made up 36% of respondents to the survey, men made up 62% and the remainder went to “other”, “prefer not to say” or no response (the gender question was not mandatory).
There is no difference in the percentage of women and men who use research software: 92% each. This is heartening news!
Differences in software development with respect to gender
Although there is no difference in the use of research software, there is a huge difference when it comes to developing software: 70% of men develop their own research software, whereas only 30% of women do.
This preponderance of men in development is reflected, as one would expect, in training. Only 39% of women had received software development training of some form, relative to 63% of men who have received training.
What can you tell from a researcher’s operating system of choice?
There is a difference, albeit not a great one, when it comes to simply using research software: 88% of Windows users are also users of research software, as compared to 93% for OS X and a remarkable 98% for Linux.
When it comes to developing research software, the differences become apparent. Only 41% of Windows users develop research software, which again is slightly behind OS X at 53%. Linux users are in a field of their own: 90% of them develop their own research software.
There’s potentially an important lesson in here for the software development community. If you want to people to use your software, you really better make sure that it runs on Mac and Windows as well as your native Linux.
How did we collect the data?
We needed results that would represent the research community, so we ran a survey that contacted 1,000 randomly selected researchers at each of 15 Russell Group universities. From the 15,000 invitations to complete the survey, we received 417 responses – a rate of 3% which is fairly normal for a blind survey.
We asked people specifically about “research software” which we defined as:
“Software that is used to generate, process or analyse results that you intend to appear in a publication (either in a journal, conference paper, monograph, book or thesis). Research software can be anything from a few lines of code written by yourself, to a professionally developed software package. Software that does not generate, process or analyse results - such as word processing software, or the use of a web search - does not count as ‘research software’ for the purposes of this survey.”
We used Google Forms to collect responses. The results were transferred to Excel for analysis and then uploaded to Google Drive for distribution.

