Jamovi - Community Driven, User-friendly Software For The Masses
Jamovi - Community Driven, User-friendly Software For The Masses
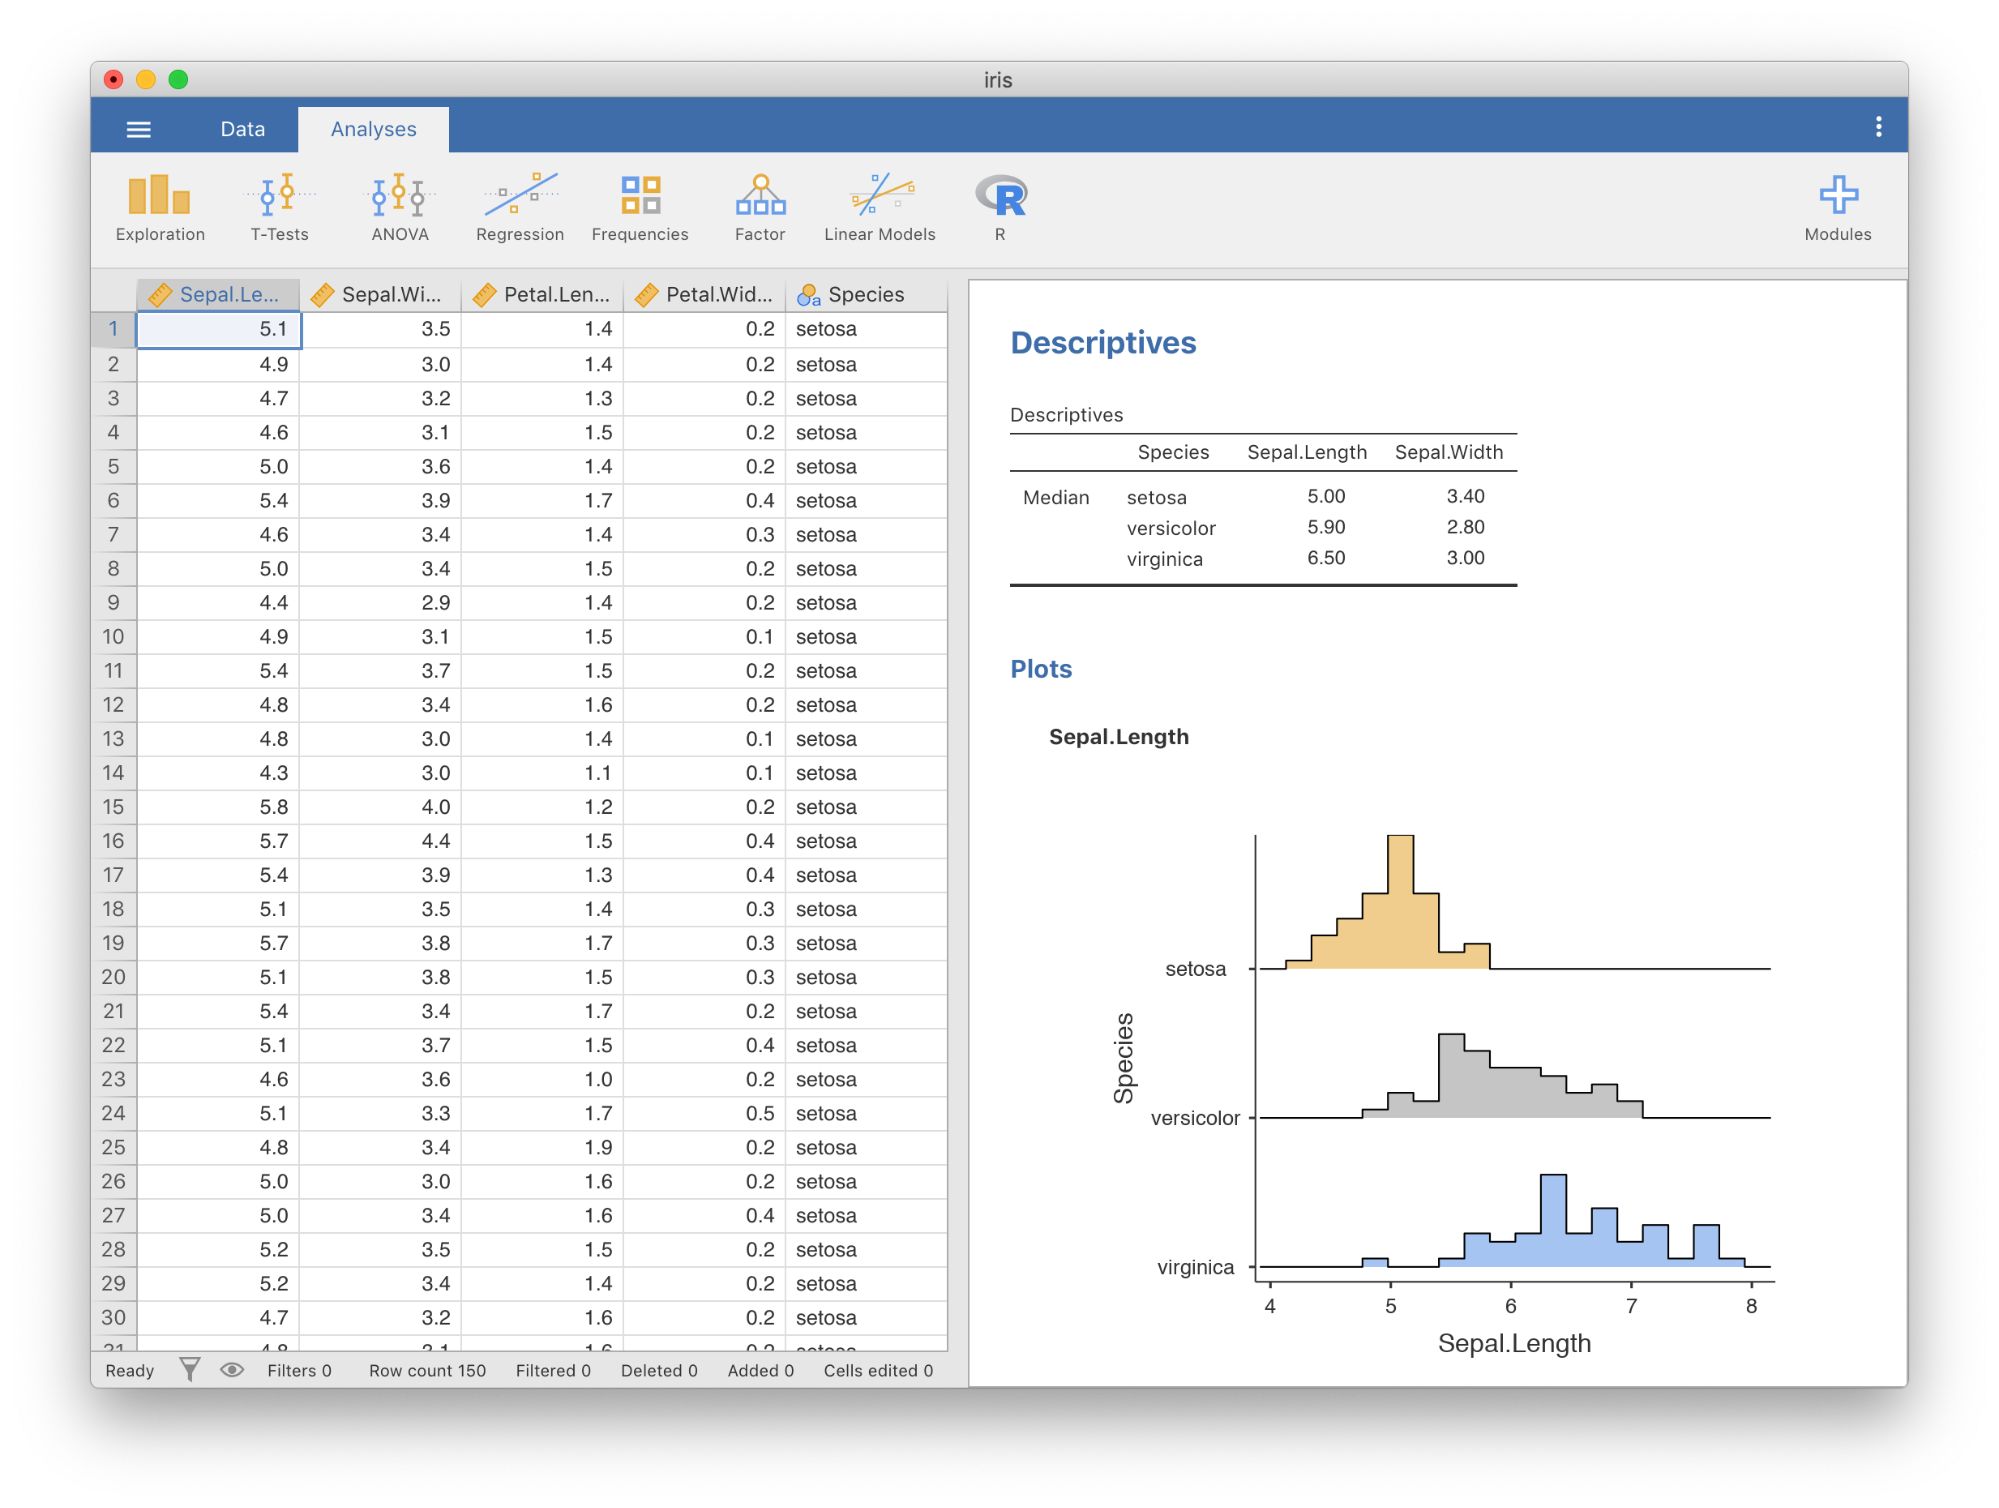 Image courtesy of Jonathon Love.
By Jonathon Love, Jamovi.
Jamovi is a user-friendly, statistical spreadsheet, built on top of R, with a mission to not just provide free easy-to-use statistical software, but to decentralise the publishing of statistical methods as much as possible.
Most of us are familiar with the success of R, CRAN, and the R community. CRAN is a repository of thousands of different statistical methods published by as diverse a group of researchers as anyone can imagine. However, when we consider graphical software – that is, user-friendly software with a user-interface – these usually have a strong emphasis on the analyses bundled with the software, and analyses developed by 3rd parties, if they’re supported at all, are more of an after-thought.
In contrast, jamovi places a much greater emphasis on the jamovi library, an ‘app store’ for people of diverse statistical and philosophical backgrounds to publish their methods as modules. Installing and using someone else’s module is as simple as browsing the library and clicking ‘install’. Menu entries for the new analyses appear in a matter of moments.
By default, Jamovi ships with the jmv module; a comprehensive module for basic statistics suitable for many researchers and undergraduate programs (indeed, jamovi is used in over 100 undergraduate programs as a user-friendly alternative to SPSS). However, it isn’t our intention that these should become the ‘ruling’ analyses – that is the defaults that everyone sticks too. (indeed, you can even hide these default analyses if you don’t want to use them).
To give you a taste of the sorts of analyses available in the Jamovi library, here are some popular examples:
-
GAMLj: A suite of linear models, including general linear models, linear mixed models, and generalised linear models
-
jAMM: A suite for the estimation of mediation models (like the PROCESS macro)
-
jsq: A suite of Bayesian hypothesis testing methods
-
MAJOR: A meta-analysis module
-
Walrus: ‘Robust’ statistical methods
-
and more …
Although Jamovi is by no means the only statistical software available with a module system, we think Jamovi is unique in providing that combination of user-friendliness, decentralised-ness, and low-cost/free-ness.
However, that’s not the only side to Jamovi. Another thing we’ve tried to do with jamovi, is to bridge the scripting/R community, with the graphical stats software using community. At the moment, many people tend to be ‘either/or’, preferring to stick with either software with a graphical user interface, like SPSS, or a scripting language like R. So what we’ve done is made a number of features available in jamovi that make it easy for people in the graphical stats world, begin to explore scripting and R syntax.
So first up, we provide a ‘syntax mode’ where the equivalent R code for all the analyses can be viewed. As the user makes changes to the options in the user interface, they can see these changes reflected in the R syntax, and in turn, the results. Further, they can simply copy and paste the R syntax into an R session, or into RStudio, giving them a really gentle introduction to R.
Additionally, we provide the Rj editor (available in the Jamovi library). This allows users to write R code directly into jamovi, and analyse the data using R without leaving the spreadsheet. This can be a great way for researchers and students to dabble in R programming without the immediate hurdle of figuring out how to import data into an R session (you might be surprised how daunted some people are by this), and from the comfort of a familiar spreadsheet interface.
So in this way we’re building bridges between the graphical stats community, and the scripting community. and if you think about what jamovi modules are – making analyses from R available with a graphical user interface, you can hopefully see that this is a two way bridge.
So that’s the jamovi philosophy in a nutshell. If you haven’t checked out jamovi, then I’d encourage you to do so. I haven’t talked about it much here, but it’s also a very attractive and enjoyable piece of software to interact with.
Visit jamovi and try it out!