The World beneath our feet
The World beneath our feet
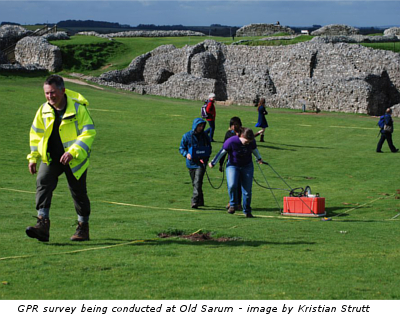 By Kristian Strutt, Experimental Officer at the University of Southampton, and Dean Goodman, Geophysicist at the Geophysical Archaeometry Laboratory, UC Santa Barbara.
This article is part of our series: a day in the software life, in which we ask researchers from all disciplines to discuss the tools that make their research possible.
Archaeological practice in the field seems so down to earth. The daily routine of excavation, recording of stratigraphy, finds and contexts, and understanding the different formation processes – it is what we are, and what we do.
However, it is easy to overlook the scientific aspects of our work that integrate with the development of how archaeology understands past human activity.
Over the last 50 years, a number of different technologies have been developed that aid archaeologists in the discovery and interpretation of remains. These remote sensing technologies both increase the extent to which we can record archaeological material over large areas and also help us avoid invasive and ultimately destructive excavations. Geophysics and remote sensing are both now routinely used in archaeology, with techniques being brought from different fields of development including military applications and hydrocarbon exploration.
The collection of data using such techniques is part of the broader approach to standard archaeological fieldwork these days. This includes the systematic collection of remotely sensed data which measures different physical properties of sub-surface deposits surveyed. Data management and the extraction of archaeological knowledge is often overlooked, however, in terms of presenting the results of archaeological work to other professionals or to the general public, with only the final interpretations being made available.
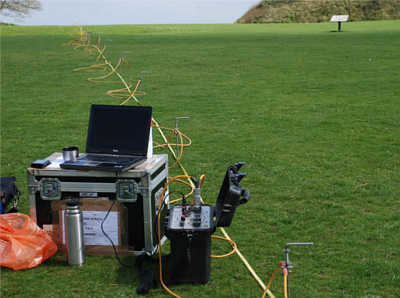
Data collection for an ERT profile at Old Sarum, using multi-probe system with laptop and ImagerPro software. Image by Kristian Strutt.
This does, however, belie a system of data processing, filtering, and representation. All these help form an archaeological perspective that combines both objective forms of data management with more subjective notions of interpretation. At its most simple, the interpretation of geophysical survey datasets depends on the best way to handle large samples of data, removing noise to isolate potential archaeological anomalies, and identifying them in a way that archaeologists and others can understand. This requires specific types of software that deals with different types of dataset and maintains the integrity of the data while processing out background noise.
Some datasets essentially map a two dimensional dataset. In the field, magnetometers and earth resistance meters collect one reading per station across a survey grid. The data is stored as a single string of values. The software, therefore, is required to reconstruct all of the readings across the survey area in the correct location as one reading per spatial location in a series of survey grids.
The software normally used to manage this form of data is either Geoplot or Terrasurveyor. Both are able to form continuous interpolations of two dimensional geophysical survey data, and allow the surveyor to view the data either numerically, or through the production of greyscale or colourscale representation. Some datasets require more complex forms of software. For example, data software is needed to manage results from Electrical Resistivity Tomography (ERT) data and Ground Penetrating or Probing Radar (GPR) data. For ERT data, software can be instrumental in the collection of data as well as the processing and visualisation of datasets. To this end, multi-probe systems, such as Allied Associates’ Tigre, use a laptop computer and ImagerPro software to program the probe configurations and collect the data.
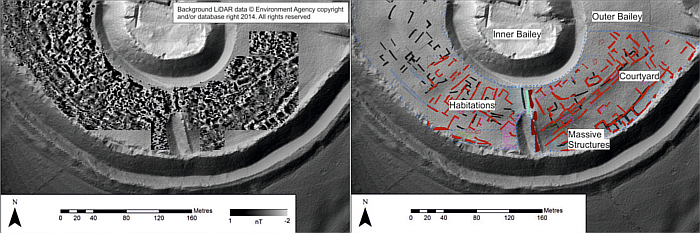
Processed magnetometer data (top) with layer of digitised interpretation (bottom) overlaid onto LiDAR data in GIS. Image by the University of Southampton.
While the surveyor cannot quite walk off-site for a cup of tea during data collection, the software is still able to run all of the necessary functions to ensure smooth data collection, with the surveyor checking the system to ensure that no errors have occurred. The final profiles of data are then modelled using least mean square inversion functions in software such as Res2DInv and Res3DInv, and ERTLab , to produce profiles and 3D models of the subsoil.
Similarly GPR data requires specific software, such as Reflex2DQuick and GPR Slice. The latter is ideal for the importation, processing and visualisation of GPR data. The latter is ideal for the importation, processing and visualisation of GPR data. While the front-end of GPR Slice appears somewhat overwhelming, with an incredible array of processing filters and ways of dealing with the data, it is ideal for converting GPR profile data into three dimensional blocks of data, which allows the ground to be ‘sliced’ to produce images of anomalies in the soil. The software also allows you to use GPS readings for the spatial location of data, and to import and combine other geophysical datasets.
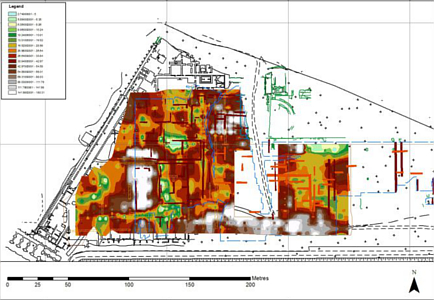
ERT dataset overlaid with GPR survey interpretation of buried structures at Portus, used as part of the Portus MOOC. Image by Kristian Strutt.
However, spatial data also plays an important role in fieldwork. Context is everything with the results of such surveys, and the requirement of programs to facilitate the integration of different forms of data to produce complete visualisations of datasets is key. Recent survey results from Old Sarum in Wiltshire illustrates the need for use of GIS (Geographic Information System) packages such as ArcGIS to represent different sets of data in situ prior to interpretation. The different facilities present in GIS packages allows for the integration of different forms of data, and the digitising of archaeological interpretations for different datasets.
Despite the specialist and quite complex nature of software used by archaeologists, the presence of free software online means that the data experience can be shared with students and interested members of the public alike. This allows them to become involved in this hidden and perhaps misunderstood area of archaeology, and may provide an arena for further debate on the issues that surround the management and processing of such datasets in the future.